Nurse staffing schedules: linking coverage, workload, and absences
How to plan nurse staffing schedules around patient care demand, competencies, and absences, using Cofen standards, metrics, and clear reassignment criteria.
Tervali Editorial Team6 min read3 sources
THE STARTING POINT
A safe schedule combines patient care needs, staff mix, and the team's actual availability. Staffing levels, daily assignment, and the response to absences are related decisions that need their own criteria and joint monitoring.
A schedule can be complete on paper and still leave a shift overloaded. This happens when filled slots do not match care needs, available experience, or actual absences. Splitting the same number of patients among staff does not demonstrate balance either: different needs can require different effort and competencies. Planning must make these differences visible before deciding who will work in each position.
Absence coverage, uneven assignments, and burnout come together in daily operations, but they have no single solution. This article proposes organizing the work on three levels: determining staffing levels, building the schedule, and assigning care on each shift. The numerical examples illustrate the method. The method supports management decisions and requires judgment from the responsible nurse, local conditions, and the applicable professional and labor obligations.
Which Cofen reference to use for staffing levels
In the official texts consulted on October 26, 2026, Cofen Resolution 743/2024 (Cofen is Brazil's Federal Nursing Council) expressly revokes Resolution 543/2017 and points to Normative Opinion 1/2024 as the reference on the subject. A spreadsheet based only on the old resolution therefore needs its basis reviewed. Resolution 743/2024 is the act of revocation; the technical parameters are in the opinion. [1][2]
Opinion 1/2024 takes into account the characteristics of the service, the team, and the patients. It sets a minimum technical safety index (IST) of 15%, a minimum addition of 5% to the overall headcount for continuing education, including coverage related to turnover, and separate staffing for management activities. It also distinguishes methods by type of service. [2] These components must appear in the calculation worksheet with identifiable assumptions. Adding a generic margin to the total headcount is not enough, nor is assuming the minimum absorbs any local absence pattern.
Separate required headcount, schedule, and shift assignment
Determining staffing levels means estimating the headcount needed to sustain the service. The schedule distributes that headcount's availability across the calendar. Shift assignment matches the staff present to specific patients, activities, and responsibilities. When these decisions are mixed together, a well-organized schedule can hide a structural shortfall, while an apparently adequate headcount can be poorly distributed between high- and low-demand hours.
As a complementary methodological reference, the World Health Organization's WISN method starts from workload and time standards for each activity component. [3] This logic helps challenge the use of bed count alone as a measure of demand, without replacing the applicable Brazilian parameters. In the local analysis, make explicit which activities are included in the estimate, which depend on a specific role or competency, and how the volume data were obtained. An estimate can only be discussed when its assumptions are visible.
THE PROCESS IN NUMBERS
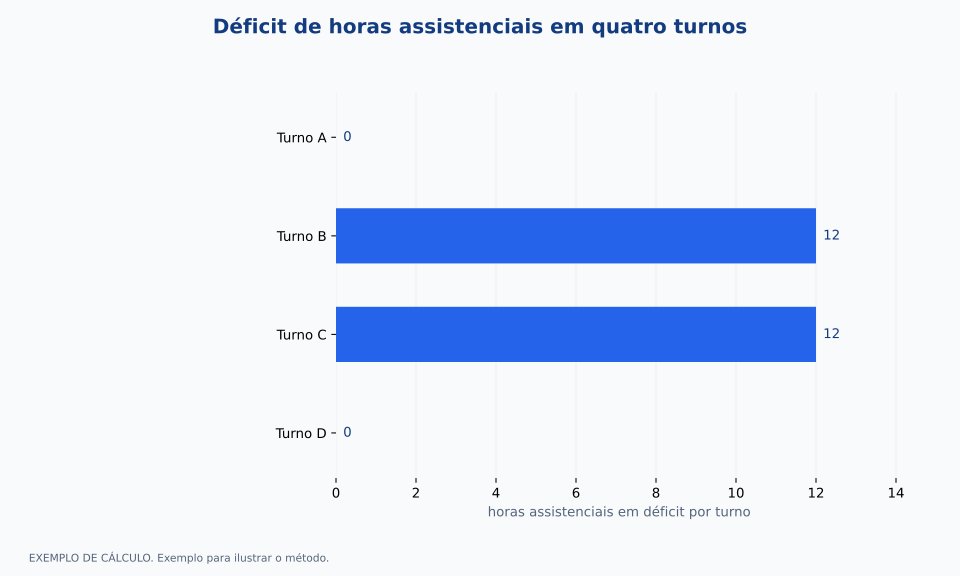
Patient care hour deficit across four shifts
Example of four shifts in one unit in the same week: need/availability A=60/60, B=60/48, C=72/60, and D=48/48 hours. Values calculated as the maximum of need minus availability and zero. This is not a normative staffing calculation or a recommended distribution.
WORKED EXAMPLEExample to illustrate the method.
Comparison by patient care hours in deficit per shiftChange the values to explore a scenario.
Measure demand and capacity without double counting
Collect data by unit, day, shift, and professional role. Record patient volume, the relevant patient classification, admissions, transfers, and activities that concentrate effort at certain times. Separate nominal availability from actual presence. Staff on vacation, on leave, or in training away from patient care do not provide the same hours for direct coverage during that period. At the same time, do not deduct again an unavailability already accounted for in the calculation method.
For inpatient units, the opinion uses patient classification and hours of care, with references of 4, 6, 10, 10, and 18 hours per patient for the minimal, intermediate, high-dependency, step-down, and intensive care categories. [2] These are 24-hour references, not individual quotas per shift. In operations, distribute the need across the day based on observation and the care profile. Counting inpatients without distinguishing their needs can produce equality that is only apparent.
Turn the assessment into scheduling rules
Before choosing a tool, define verifiable criteria: coverage by role, required competencies, contracted hours, work restrictions, and applicable rest rules. Distinguish mandatory requirements from negotiable preferences, such as certain time-off requests. Leadership should be able to explain why a proposal was accepted or rejected. Exceptions need a justification and an owner; they cannot disappear into a series of informal swaps.
An automated schedule should surface conflicts and preserve professional review. Test situations such as leave starting mid-month, the departure of a staff member with a specific competency, and a change in the unit's operating hours. Also consider whether reassignment takes capacity away from another unit. The operational gain may be less time spent building the schedule, but that only helps if actual coverage and workload distribution are monitored. A quick solution that generates more corrections later does not fix the process.
Cover call-outs and investigate absence patterns
Set up a workflow for unplanned absences: notification through an official channel, confirmation of impact, evaluation of alternatives, and a recorded decision. Leadership checks attendance, competencies, and demand before calling in coverage or reassigning staff. Senior management needs to be informed when the alternatives do not restore the required capacity. Repeated overtime as the default response can mask a staffing need or a persistent organizational problem.
When monitoring absences, establish a definition of absenteeism and keep vacations, open positions, and leaves of absence separate, depending on the purpose of the metric. Analyze aggregate patterns by unit and shift, with restricted access to individual information. Do not use health data for a punitive ranking. Unstable schedules, working conditions, leadership, and turnover are hypotheses to investigate with staff and HR; a coincidence between call-outs and overloaded shifts does not, on its own, prove a causal relationship or identify individual responsibility.
What the example chart can show
The chart shows an example of four shifts in one unit over a week. Each shift received its own estimate of need and a tally of hours actually available for patient care, using the same definition of time. In scenario A, 60 hours were needed and 60 provided; in B, 60 and 48; in C, 72 and 60; in D, 48 and 48. The deficit is the positive difference between need and availability: zero, twelve, twelve, and zero hours.
These values were invented solely to teach how to read the chart and do not result from a complete normative calculation. Two shifts with a twelve-hour deficit may require different responses depending on the role and competency that is missing. In addition, an adequate aggregate balance can hide an uncovered time window. That is why the dashboard must allow users to examine the hours and roles involved. Adding up RN and nursing technician hours indiscriminately can hide a gap that reassignment across roles cannot close.
Test the change and watch for unintended effects
Start with one unit, with participation from leadership, shift staff, HR, and senior management. Document the baseline, the demand method, and the coverage rules. Run a proposed schedule in parallel with the usual review before replacing the current process. Compare the conflicts found, the actual feasibility of coverage, and the time needed to correct the proposal. Keep the versions so you can understand why each decision was made.
Track coverage by role, overtime, reassignments, and changes after publication. Also watch for reports of overload and pending care activities, without treating a single fluctuation as a definitive result. The first useful deliverable is a reviewable calculation worksheet and an absence workflow that someone can actually execute. If the analysis shows a structural deficit, the decision must reach whoever can adjust resources and capacity. Organizing the schedule helps use the available headcount; hiring or reorganizing the service requires its own management decision.
FROM READING TO PRACTICE
Checklist to discuss with your team
Check off the items already in place. Use the rest as a working agenda.
WHAT TO TRACK
Clearly defined indicators
Actual coverage by role
Hours actually available for patient care / estimated required hours, in the same unit, role, and shift × 100.
Do not offset an RN deficit with a surplus of nursing technicians. The quality of the demand estimate limits the metric.
Shifts with a deficit
Shifts with at least one interval below the defined requirement / shifts observed × 100.
Report role, duration, and coverage rule; the monthly total of hours can hide short-term gaps.
Unplanned absence
Hours of unplanned absence / scheduled hours originally planned for patient care in the period × 100.
An operational convention of this article; define which events are included and freeze the denominator so adjustments do not erase call-outs.
Overtime intensity
Overtime hours actually worked / total hours actually worked in the period × 100.
Distinguish emergency coverage from planned activity and reconcile records with HR.
Changes after publication
Published shifts with at least one change / published shifts in the period × 100.
Classify the reason and distinguish staff-requested swaps from changes needed to cover a deficit.
FREQUENTLY ASKED QUESTIONS
Questions about this topic
Should Cofen Resolution 543/2017 still be the basis for the schedule?
It was revoked by Resolution 743/2024. The official portal refers to Normative Opinion 1/2024 for planning parameters. Local documentation must identify the reference that applies to the service and be revised whenever the regulations are updated. [1][2]
Does dividing the number of patients equally balance the workload?
A headcount alone does not describe care needs, the concentration of activities, or the required competencies. Daily assignment should combine this information and be revisited when the demand profile changes.
Can scheduling software solve a staff shortage?
It can make conflicts visible and support distribution and replacement. A persistent lack of capacity requires a decision about headcount, organization, and service capacity; the system does not create available staff.
Sources and references
Primary sources used to produce this content. Implementation recommendations should be adapted and validated by each institution.
Items 1.1 to 1.4 and 2.8: planning components, IST, continuing education, management activities, and hours-of-care references for inpatient units. The chart figures are a worked example.
We use browser storage to remember your choice and, if you accept, Umami to count visits in aggregate, without cookies and without identifying you. Nothing is used for advertising. Privacy Policy.