Metrics and costs in healthcare management: how to build reliable numbers
Organize a metrics dictionary, validate data, and connect costs to patient care output with formulas, owners, and an example of a monthly cost close.
Tervali Editorial Team6 min read3 sources
THE STARTING POINT
Reliable metrics require a shared definition, an identified source, and validation before the management meeting. To interpret costs, you need to link supplies, staffing, and services to output in the same period, with explicit allocation criteria.
When nursing, the controller's office, and billing present different numbers for the same unit, the meeting starts with an argument over the spreadsheet. The problem may lie in the definition of an encounter, the cutoff time, or a late update. Automating the extraction without resolving these differences only speeds up the circulation of incompatible results.
Managing metrics and costs in healthcare means answering three questions: what is being measured, which records support the calculation, and what decision will be made. This guide proposes a minimum set of definitions, controls, and responsibilities to address unreliable manual metrics and opaque costs. The operational recommendations need to be adapted to each service.
Start with the decision the metric should support
Choose a well-defined management question: why did the cost per patient day change in this unit? Define who can act on the result, in which meeting, and with what supporting evidence. Without that link, the dashboard piles up measures that no one can turn into a verifiable action. A cost reduction must also be examined alongside the service's capacity and quality.
The Brazilian Ministry of Health presents the National Cost Management Program (PNGC) as support for systematic cost accounting, the structuring of cost centers, and the use of ApuraSUS, its cost accounting system. The program covers monthly costs and average unit costs of each department's outputs. This provides an institutional reference for organizing the discussion, without automatically making facilities with different care profiles comparable. [1]
Write a metrics dictionary that can actually be executed
Each definition sheet should state the name, purpose, numerator, denominator, unit of measure, included population, exclusions, period, source, owner, and version. Add the rounding rule, handling of missing data, closing date, and review criteria. These fields are a practical governance proposal. The WHO includes standardized lists and denominator challenges among the foundations of health facility data analysis. [2]
For cost per patient day, specify which costs go into the numerator and how output is counted each day. Do not substitute the number of admissions for patient days. Define how transfers and records corrected after the close are handled. An executable definition sheet allows two people to reproduce the result without turning to the author of the original spreadsheet. If the rule changes, record the effective date and assess the break in the historical series.
Definition owner: validates meaning, inclusions, and interpretation.
Data owner: confirms origin, coverage, and timeliness.
Calculation owner: runs the formula and keeps the version used.
THE PROCESS IN NUMBERS
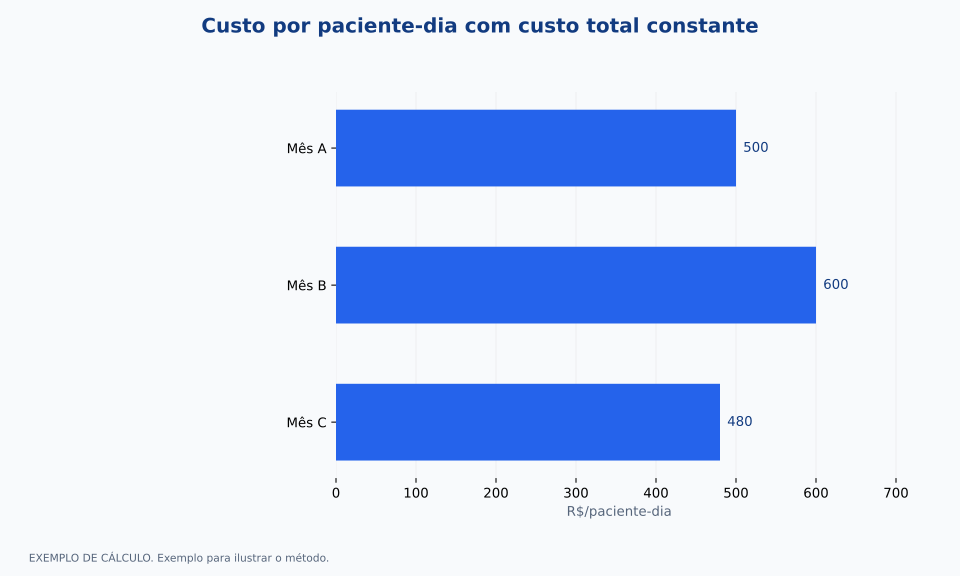
Cost per patient day with constant total cost
Example: R$ 300,000 in total cost per month. Denominators: month A, 600 patient days; month B, 500; month C, 625. Values calculated by division.
WORKED EXAMPLEExample to illustrate the method.
Comparison by R$/patient dayChange the values to explore a scenario.
Validate coverage and consistency before interpreting performance
The WHO organizes data review into dimensions such as completeness, internal consistency, and external comparisons. [3] In local practice, this can become a simple sequence: check expected files, required fields, duplicates, and consistency between totals and subtotals. An unusual value should trigger an investigation. It should not be quietly corrected to bring the result closer to the target or to the previous month.
Missing information is not the same as zero. If a unit has not submitted its output, the unit cost should remain pending, with the reason visible. If the denominator is zero, do not present an artificially adjusted division. Separate provisional data from closed data and keep a log of corrections. Before the meeting, report which sources are complete and which limitations could change the conclusion about the period.
Connect costs and output with explicit criteria
Propose a matrix linking cost centers, supply items, staffing, contracts, and output. Costs identifiable with a department can be assigned directly; shared expenses require a documented criterion. Floor area, processing volume, or another operational basis may be candidates, depending on the nature of the expense. The choice must make sense for that resource and be approved by the controller's office, with an analysis of its limitations.
Purchase, consumption, payment, and allocated cost are not equivalent events. A purchased supply may remain in inventory; a payment may relate to a different accounting period. Preserve the link between source documents, movements, and the amounts allocated to the month. The institutional method should also spell out the treatment of depreciation, outsourcing, and internal transfers. This article does not replace the accounting policy or define an official costing methodology.
Worked example: unit cost can rise without an increase in the total
Consider a unit with an allocated monthly cost of R$ 300,000 over three months. Output is 600, 500, and 625 patient days, respectively. The average cost is R$ 500, R$ 600, and R$ 480 per patient day. The chart shows these calculations, keeping the same cost scope.
In the second month, output falls and the unit cost rises, even though the total cost stays the same. This justifies investigating available capacity, cost structure, and changes in the care profile. It does not demonstrate waste or justify cutting staff. Before comparing units, check the set of services included and differences in complexity. Also, do not confuse average accounting cost with savings that could actually be achieved by reducing output by one unit.
Turn the cost close into a process backed by evidence
The process map below starts with the sources and ends with a tracked decision. For each step, set an observable output: batch received, inconsistency report, calculation worksheet, approval, and recorded action. Archive the version of the formula and the time of extraction. This makes it possible to explain why a published value changed, without turning the history into a series of overwritten spreadsheets.
A cost review should reconcile the source amounts with the final allocations. Differences need an owner, a justification, and a defined treatment. On the executive dashboard, show the result together with the update date and the validation status. Keep detailed financial data in an authorized environment, using aggregates in broader discussions. No example in this guide requires a patient's name, diagnosis, or any other identifiable data.
Test the routine before expanding the dashboard
Start with one unit and one closed period. Redo the calculation with the source owners and compare the manual calculation with the proposed routine. The acceptance criterion can be reproducing the result from the same records, with every difference explained. This implementation choice is an operational recommendation, not a mandatory deadline or a promise of benefit.
At the next meeting, check whether the decision produced an owner, a deadline, and evidence of completion. Record the questions that require new data collection instead of immediately multiplying metrics. A useful dashboard lets people challenge the calculation with documents and revisit the interpretation. The next step is to stabilize this closing routine and only then bring in other units, preserving the differences in scope that make each comparison valid.
FROM READING TO PRACTICE
Checklist to discuss with your team
Check off the items already in place. Use the rest as a working agenda.
WHAT TO TRACK
Clearly defined indicators
Average cost per patient day
Costs allocated to the unit in the month, within the approved scope, divided by the daily sum of inpatients in the same unit and month; unit: R$/patient day.
A zero denominator produces a result that cannot be calculated. Compare only equivalent scopes; this does not estimate marginal cost or the savings from a cut.
Completeness of required fields
100 × required fields validly filled in / required fields expected in the batch records; exclude non-applicable fields according to a documented rule.
High completeness does not prove accuracy. Also show the number of records received versus expected.
Source timeliness
100 × deliveries received by the agreed deadline / deliveries expected in the period.
The deadline is a local agreement; a single late source can jeopardize the close even when the others arrive on time.
Reconciliation difference
Total source costs within scope minus total allocated after allocations, using the same accounting period and adjustment rules; unit: R$.
Every difference requires an explanation. A zero difference can also hide inappropriate classifications or allocations.
FREQUENTLY ASKED QUESTIONS
Questions about this topic
Can we start with spreadsheets?
Yes, as long as there is an identified source, an approved calculation rule, version control, and review. Automation should preserve these controls and reduce repetitive tasks.
Does a lower cost per patient day mean better performance?
Not on its own. Changes in output, care profile, and cost scope can alter the result. Interpretation must consider quality, capacity, and comparability.
How should a metric with a missing denominator be handled?
Keep the result pending and identify the missing source. Do not turn missing data into zero or use an estimated denominator without an explicit rule and flag.
Sources and references
Primary sources used to produce this content. Implementation recommendations should be adapted and validated by each institution.
Review dimensions: completeness, internal consistency, and external comparisons. The local routines proposed in the article are the author's adaptations.
Educational content on management and technology. It does not replace professional judgment, current regulations or clinical protocols.
We use browser storage to remember your choice and, if you accept, Umami to count visits in aggregate, without cookies and without identifying you. Nothing is used for advertising. Privacy Policy.